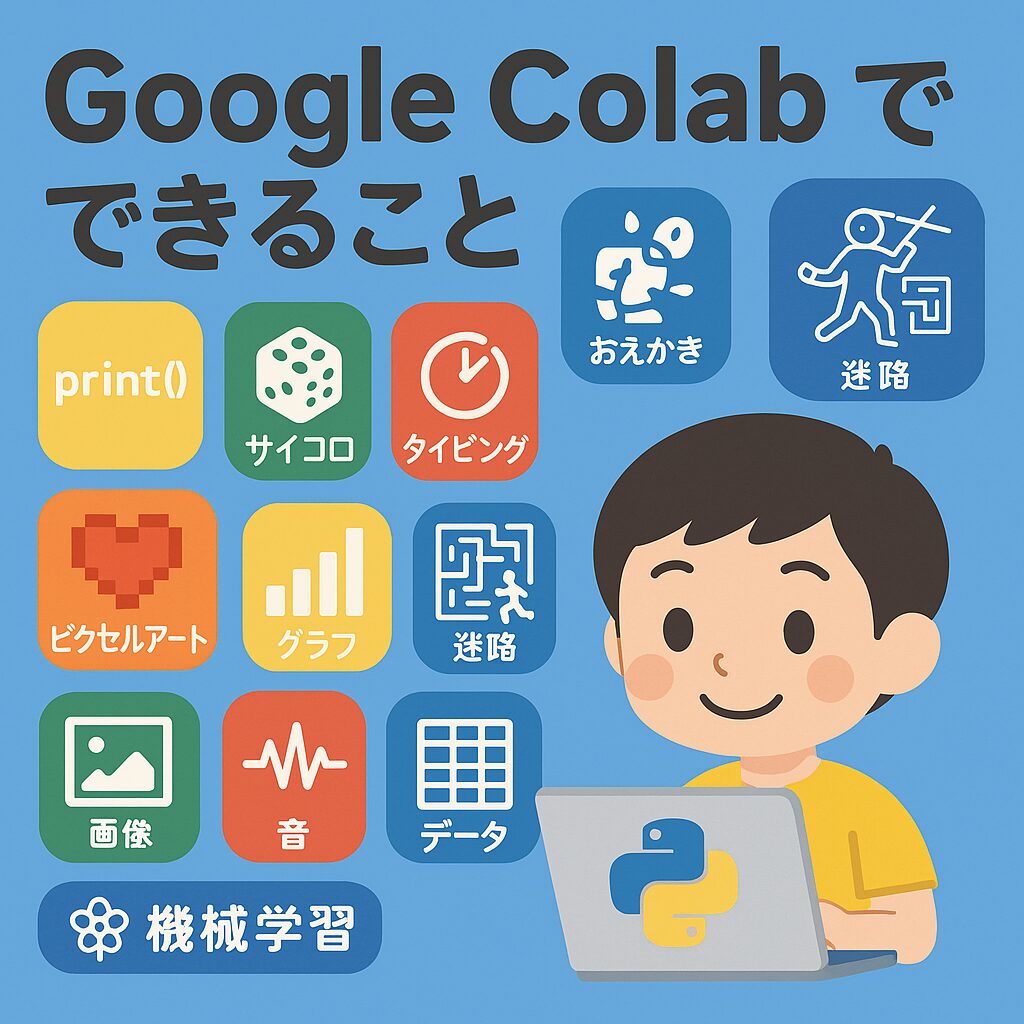
この記事ではGoogleColobで簡単に作成できるPythonのプログラムをご紹介します。
1) ウォームアップ:Pythonことばあそび(小3~)
ねらい:print/変数/文字列
使うライブラリ:なし
name = input("なまえを入れてね:")
print(f"{name}さん、こんにちは!Pythonへようこそ!")
print(("★" * 10) + "\n" + ("Pythonたのしい!\n" * 3))
2) サイコロ&じゃんけん(小3~)
ねらい:乱数/条件分岐
import random
hands = ["グー", "チョキ", "パー"]
my = input("グー/チョキ/パー を入力:")
pc = random.choice(hands)
print("PC:", pc)
if my == pc:
    print("あいこ!")
elif (my, pc) in [("グー","チョキ"), ("チョキ","パー"), ("パー","グー")]:
    print("あなたの勝ち!")
else:
    print("あなたの負け!")
3) タイピング・ミニゲーム(小3~)
ねらい:ループ/時間計測
import time, random
words = ["apple","banana","cat","dog","grape","python"]
target = random.choice(words)
print("お題:", target)
t0 = time.time()
ans = input("タイプしてEnter:")
t1 = time.time()
print("タイム:", round(t1 - t0, 2), "秒", "/正解!" if ans == target else "/おしい!")
4) タートル風おえかき(小3~)
ねらい:図形/座標
※Colabはturtleが弱いので、matplotlibで“タートル風”に描写。
import matplotlib.pyplot as plt
import numpy as np

x = [0,1,1,0,0]  # 四角形
y = [0,0,1,1,0]
plt.plot(x, y, marker="o")
plt.axis("equal"); plt.grid(True); plt.show()
5) ピクセルアート生成(小4~)
ねらい:2次元配列/色
import numpy as np, matplotlib.pyplot as plt
canvas = np.zeros((16,16,3))         # 16x16のRGB
canvas[4:12, 4:12] = [1,0,0]         # 赤い四角
canvas[6:10, 6:10] = [1,1,0]         # 黄色の小さい四角
plt.imshow(canvas); plt.axis("off"); plt.show()
6) グラフで「見える化」(小4~)
ねらい:リスト/グラフ
import matplotlib.pyplot as plt
days = ["月","火","水","木","金"]
study = [20, 30, 40, 25, 35]  # 分
plt.bar(days, study)
plt.title("1週間の学習時間"); plt.ylabel("分")
plt.show()
7) 迷路を脱出!(小5~)
ねらい:2次元リスト/探索
maze = [
  list("########"),
  list("#S.....#"),
  list("###.####"),
  list("#......#"),
  list("####.###"),
  list("#.....G#"),
  list("########"),
]
start = (1,1); goal = (5,6)
from collections import deque
q = deque([start]); dist = {start:0}
while q:
    x,y = q.popleft()
    if (x,y)==goal: break
    for dx,dy in [(1,0),(-1,0),(0,1),(0,-1)]:
        nx,ny = x+dx, y+dy
        if maze[nx][ny]!="#" and (nx,ny) not in dist:
            dist[(nx,ny)] = dist[(x,y)]+1
            q.append((nx,ny))
print("最短歩数:", dist.get(goal,"行けない…"))
8) 画像で遊ぶ:フィルター(小5~)
ねらい:Pillowで画像処理(ローカル画像をアップロード)
from PIL import Image, ImageOps, ImageFilter
from google.colab import files
up = files.upload()  # 画像を1枚アップロード
name = list(up.keys())[0]
img = Image.open(name)

# モノクロ+ぼかし
out = ImageOps.grayscale(img).filter(ImageFilter.GaussianBlur(3))
out
9) 音を作る:シンセ入門(小5~)
ねらい:numpy/波の理解
import numpy as np
from IPython.display import Audio

sr = 22050
t = np.linspace(0, 1.0, int(sr), endpoint=False)
freq = 440  # ラ
wave = 0.5*np.sign(np.sin(2*np.pi*freq*t))  # 矩形波
Audio(wave, rate=sr)
10) かんたん表データ分析(小5~)
ねらい:pandas入門(CSVを自作して読み込み)
import pandas as pd
csv = """name,score
Aoi,78
Ken,92
Mina,85
Ren,60
"""
open("scores.csv","w").write(csv)
df = pd.read_csv("scores.csv")
print(df.describe())
df.sort_values("score", ascending=False)
11) はじめての機械学習:花の分類(小6~中)
ねらい:教師あり学習の流れ(学習→予測)※トークン不要
from sklearn.datasets import load_iris
from sklearn.model_selection import train_test_split
from sklearn.neighbors import KNeighborsClassifier
iris = load_iris()
X_train,X_test,y_train,y_test = train_test_split(iris.data, iris.target, test_size=0.2, random_state=0)
model = KNeighborsClassifier(n_neighbors=3).fit(X_train,y_train)
print("正解率:", model.score(X_test,y_test))
12) インタラクティブ実験(中学~):スライダーで関数を動かす
ねらい:ipywidgetsで体験型学習
import numpy as np, matplotlib.pyplot as plt
from ipywidgets import interact

def plot(a=1.0, b=0.0):
    x = np.linspace(-5,5,200)
    y = a*x + b
    plt.figure()
    plt.plot(x,y)
    plt.ylim(-10,10); plt.grid(True); plt.title(f"y = {a}x + {b}")
    plt.show()

interact(plot, a=(-3.0,3.0,0.1), b=(-5.0,5.0,0.5))


コメント